
Cape Town Suburbs List and Map: 85 Areas in 9 Corridors
How many suburbs are in Cape Town? Several hundred named ones; buyers work with about 85. The list by corridor, Atlantic Seaboard to Northern Suburbs.
By Cape Town Invest Editorial · Updated October 5, 2026 · 12 min read
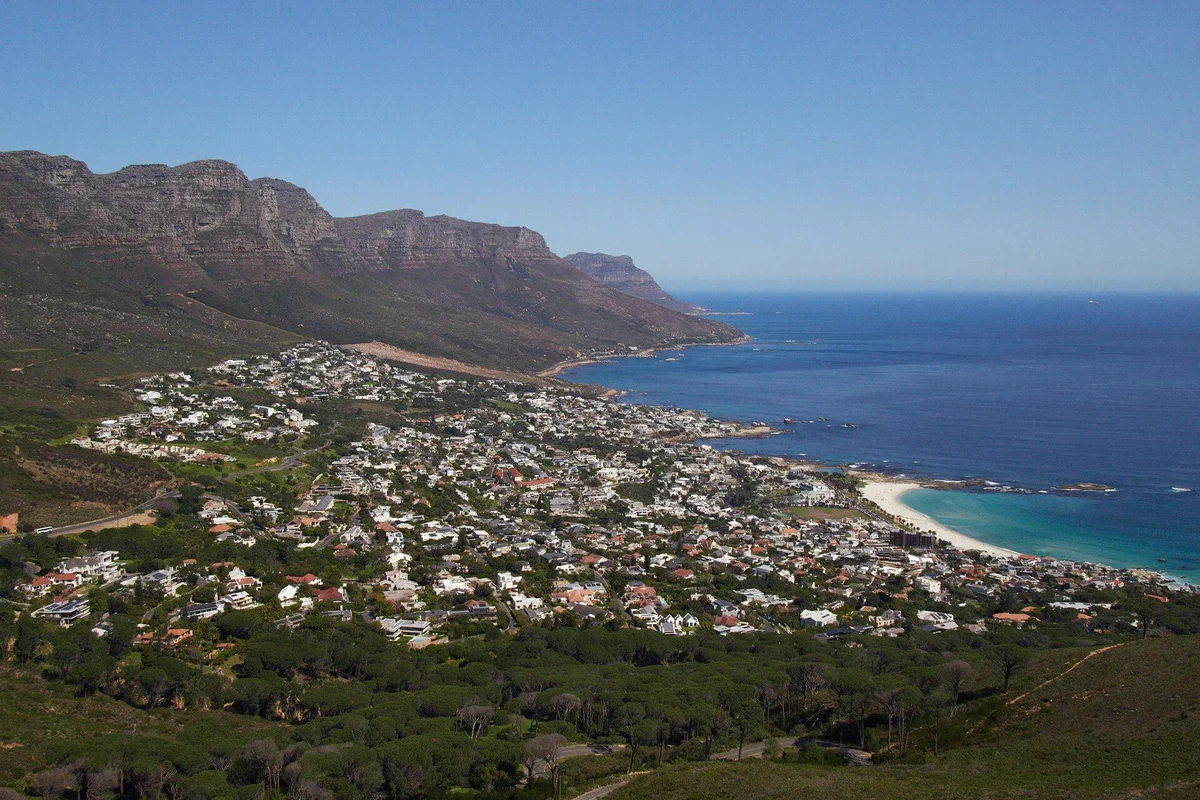
Quick answer: nine corridors cover almost every Cape Town purchase decision. The Atlantic Seaboard is the expensive coastal one at R80,000 to R200,000+ per square metre, with the City Bowl behind it at R55,000 to R95,000. The Southern Suburbs are the inland school belt. The Northern Suburbs are the value corridor from about R30,000. Blaauwberg, False Bay, the Helderberg, the Winelands and the Overberg coast complete the map. This page places every suburb in one of them.
How many suburbs are in Cape Town? A list of Cape Town suburbs by corridor
Cape Town has several hundred named suburbs, but a buyer works with about 80 to 85 of them across nine corridors. The tables on this page name 85: 11 on the Atlantic Seaboard, 10 in the City Bowl, 18 in the Southern Suburbs and 16 in the Northern Suburbs, with the remaining 30 on the coast, in the Helderberg, the Winelands and the Overberg.
| Corridor | Suburbs and towns named | Indicative entry per sqm |
|---|---|---|
| Atlantic Seaboard | 11 | R80,000 |
| City Bowl | 10 | R55,000 |
| Southern Suburbs | 18 | R40,000 |
| Northern Suburbs | 16 | R30,000 |
| Blaauwberg and West Coast | 9 | R32,000 |
| False Bay and Southern Peninsula | 9 | varies widely |
| Helderberg | 3 | varies widely |
| Cape Winelands | 4 | varies widely |
| Overberg and far West Coast | 5 | varies widely |
Counts are the suburbs and towns named in this page’s own tables, so they measure coverage here, not the City’s official suburb register. The price per square metre bands come from the suburb price table, and the highest rental yield suburbs page ranks the same suburbs on income instead of cost.
How is Cape Town actually divided?
Nine corridors, and each is defined by a physical feature rather than by an administrative line. Mountain, coast and the N1 do the sorting, which is why suburbs inside a corridor behave alike and suburbs across a boundary do not, even when they sit two kilometres apart.
| Corridor | Runs from, to | Indicative entry | Character |
|---|---|---|---|
| Atlantic Seaboard | Mouille Point to Llandudno | R80,000 psqm | Coastal, scarce, most expensive |
| City Bowl | The CBD up to Vredehoek | R55,000 psqm | Central, sorted by altitude |
| Southern Suburbs | Woodstock to Steenberg | R40,000 psqm | Inland school belt |
| Northern Suburbs | Goodwood to Kraaifontein | R30,000 psqm | Value, freehold, N1 corridor |
| Blaauwberg and West Coast | Milnerton to Melkbosstrand | R32,000 psqm | Beach at a discount, family stock |
| False Bay and Southern Peninsula | Muizenberg to Kommetjie | varies widely | Lifestyle coast, longest commute |
| Helderberg | Somerset West to Gordon’s Bay | varies widely | Coastal town feel, estate stock |
| Cape Winelands | Stellenbosch to Wellington | varies widely | Estate and village, semigration draw |
| Overberg and far West Coast | Hermanus, Langebaan, Yzerfontein | varies widely | Second homes and retirement |
The bands come from our suburb price table, which owns the full metro pricing and models listed prices against observed long-let rents. Where a corridor shows “varies widely” it is because the stock inside it ranges from village cottages to wine estates, and a single band would mislead rather than help.
The Atlantic Seaboard
The Atlantic Seaboard is eleven addresses along one road, from Mouille Point to Hout Bay, bounded by mountain on one side and sea on the other. That geography is why nothing new can be built at scale, and why entry prices start at R80,000 per square metre and run past R180,000 in Clifton and Bantry Bay.
| Suburb | Position | Our coverage |
|---|---|---|
| Mouille Point | Flat strip below Green Point | Atlantic Seaboard guide |
| Green Point | Stadium and V&A side | Green Point |
| Three Anchor Bay | Pocket between Green Point and Sea Point | Atlantic Seaboard guide |
| Sea Point | The dense promenade node | Sea Point |
| Bantry Bay | Wind-sheltered, above the road | Bantry Bay |
| Fresnaye | Elevated freehold above Sea Point | Fresnaye |
| Clifton | Four beaches, scarcest view stock | Clifton |
| Camps Bay | Beachfront, the brand address | Camps Bay |
| Bakoven | Small cluster past Camps Bay | Camps Bay |
| Llandudno | Enclave, under 200 homes | Llandudno |
| Hout Bay | Valley and harbour, over Suikerbossie | Hout Bay |
The City Bowl
The City Bowl is ten addresses in the amphitheatre between Table Mountain, Signal Hill and Devil’s Peak, sorted almost entirely by how high up the slope they sit. Entry starts at about R55,000 per square metre, and Higgovale, the highest suburb on the slope, carries the largest erven.
| Suburb | Position | Our coverage |
|---|---|---|
| City Centre | The flat, north of the ridge | City Bowl guide |
| De Waterkant | Heritage quarter above the CBD | De Waterkant |
| Bo-Kaap | West slope, heritage protected | City Bowl guide |
| Schotsche Kloof | Above Bo-Kaap | City Bowl guide |
| Gardens | Below the mountain, deep tenant pool | Gardens |
| Tamboerskloof | West of Gardens, established | Tamboerskloof |
| Higgovale | Highest, largest erven | City Bowl guide |
| Oranjezicht | Mountain side, family stock | City Bowl guide |
| Vredehoek | East slope under Devil’s Peak | City Bowl guide |
| Zonnebloem and University Estate | Eastern slope toward Woodstock | City Bowl guide |
The Southern Suburbs, Northern Suburbs and the coast
The Southern Suburbs hold 18 suburbs, the Northern Suburbs 16 and the Blaauwberg coast 9, and each corridor has its own page because it holds enough suburbs to need one. Entry prices run from R40,000 per square metre in the Southern Suburbs to R30,000 in the Northern Suburbs and R32,000 on the Blaauwberg coast.
| Corridor | Suburbs it holds | Full page |
|---|---|---|
| Southern Suburbs | 18, Woodstock to Steenberg, including Rondebosch, Newlands, Claremont, Constantia, Wynberg, Plumstead, Tokai | Southern Suburbs |
| Northern Suburbs | 16, Goodwood to Kraaifontein, including Bellville, Durbanville, Brackenfell, Parow, Plattekloof | Northern Suburbs |
| Blaauwberg and West Coast | Milnerton, Century City, Table View, Blouberg, Bloubergstrand, Big Bay, Sunset Beach, Parklands, Melkbosstrand | Blouberg, Table View, Milnerton |
The Blaauwberg corridor is the one most often misfiled. Buyers arriving from outside Cape Town group Milnerton, Century City and Table View with the Northern Suburbs because they are north of the CBD. They are coastal, they carry the south-easter directly, and their commute runs along the R27 rather than the N1. Treat them as their own corridor. The Century City guide covers the master-planned precinct inside it.
False Bay, the Helderberg and beyond the metro
Four corridors sit at or past the metro edge: False Bay with 9 suburbs, the Helderberg with 3, the Winelands with 4 and the Overberg with 5. They share one feature, which is that the commute stops being a detail and becomes the purchase decision, with the Helderberg about 40 minutes from the CBD.
| Corridor | Suburbs | What defines it |
|---|---|---|
| False Bay and Southern Peninsula | Muizenberg, St James, Kalk Bay, Fish Hoek, Glencairn, Simon’s Town, Noordhoek, Kommetjie, Scarborough | Warmer water, surf and village life, the longest commute in the metro |
| Helderberg | Somerset West, Strand, Gordon’s Bay | Coastal towns with estate stock, 40 minutes from the CBD |
| Cape Winelands | Stellenbosch, Paarl, Franschhoek, Wellington | Estate and village stock, the strongest semigration draw |
| Overberg and far West Coast | Hermanus, Kleinmond, Betty’s Bay, Langebaan, Yzerfontein | Second homes and retirement, seasonal letting markets |
Our coverage of these runs through Kalk Bay and False Bay, Somerset West, Stellenbosch, Paarl, Franschhoek and Hermanus.
The price gap between corridors is the most useful number on the map. Indicative entry runs from R30,000 per square metre in the Northern Suburbs to R80,000 on the Atlantic Seaboard, so as a worked example a 60 square metre flat costs about R1.8 million at the low end and R4.8 million at the high end. Between them the Blaauwberg coast at R32,000 gives R1.92 million, the Southern Suburbs at R40,000 gives R2.4 million and the City Bowl at R55,000 gives R3.3 million. Those are entry bands, not averages, and they exclude the premium for views, but they show why a buyer should choose the corridor before the suburb. A non-resident funded to about 50% by a local bank needs roughly half of each figure in cash before costs, so the corridor choice also sets the size of the cheque.
Which suburb names are most often confused?
Suburb names are confused more often than most buyers expect, and the confusion costs real money when a buyer underwrites the wrong address. At least 5 names in the table below are shared with Johannesburg suburbs. Several Cape Town suburb names are shared with Johannesburg suburbs, and several Cape Town addresses are marketed under a neighbouring suburb’s name because it sells better.
| Name | The Cape Town address | What it is confused with |
|---|---|---|
| Newlands | Southern Suburbs, cricket and rugby grounds | Newlands in Johannesburg, a different market entirely |
| Claremont | Southern Suburbs retail hub | Claremont in Johannesburg |
| Kensington | Goodwood, Northern Suburbs | Kensington in Johannesburg, far better known |
| Wynberg | Southern Suburbs, village and east side | Wynberg in Sandton |
| Observatory | Southern Suburbs, UCT and hospital belt | Observatory in Johannesburg |
| Constantia | Southern Suburbs green belt | The Constantia wine route, a tourism brand covering several farms |
| Salt River and Woodstock | Filed City Bowl by the City, Southern Suburbs by agents | Themselves, in two different search filters |
| Southern Suburbs | The inland school belt | The Southern Peninsula, a different coast entirely |
Two consequences follow. First, a national property search that is not pinned to the Western Cape will return Johannesburg stock for at least five of the names above, and the prices are not comparable. Second, a development can be marketed under an address it does not occupy: Zero2One carries Sea Point in a great deal of agent material and is a tower on Adderley Street in the CBD, which is a different letting market with different rents.
Insider tip: before you compare two listings, check the suburb code or the erf number rather than the suburb name. The City’s own property records are the arbiter, and they resolve every one of the collisions above in a way that a listing headline does not.
What changes when you cross a corridor boundary?
The tenant pool, the cost stack, the buyer pool and the regulatory exposure all move at once at a boundary, which is why corridors are a more useful unit than suburbs. Two suburbs on opposite sides can sit 2 kilometres apart and answer completely different investment questions.
The tenant pool changes. A City Bowl flat lets to a professional or a visitor; a Southern Suburbs house lets to a family on an academic-year lease; a Northern Suburbs house lets to a local household paying from local salaries. Each pool renews on a different cycle and tolerates a different rent, and a vacancy in one behaves nothing like a vacancy in another.
The cost stack changes. Sectional title dominates the Atlantic Seaboard and the City Bowl, so a levy and a body corporate sit between the owner and the property. Freehold dominates the Northern Suburbs and much of the Southern Suburbs, so the owner carries maintenance directly and answers to nobody. Neither is cheaper in the abstract, but they fail in different ways: a levy surprises you by vote, a roof surprises you by weather.
The buyer pool changes, and with it the sensitivity to interest rates. The coastal corridors carry a large share of cash and offshore-funded purchases, so a rate move barely registers. The inland corridors are financed locally, so the same move changes what a household can borrow and therefore what a house is worth. The non-resident mortgage guide covers the financing side for buyers coming from outside South Africa.
The regulatory exposure changes. Nightly letting rules bite hardest where nightly letting is dense, which means the Atlantic Seaboard and the City Bowl feel a by-law change first and the Northern Suburbs barely feel it at all. Our short-term letting rules guide tracks what the City has proposed and where it lands.
How should you check whether a suburb is safe?
We publish no safety ranking, and the reason is a data problem rather than a reluctance to answer. SAPS reports crime by police precinct, precincts do not align with suburb boundaries, and a single precinct routinely covers streets with very different conditions. A number attached to a suburb name would look authoritative and mean very little.
Four checks give a better answer than any ranking would:
- Find the police precinct that covers the address, then read the SAPS quarterly release for that precinct. Precinct is the unit the data actually exists in, so start there rather than with the suburb name.
- Contact the neighbourhood watch or community policing forum. They operate at street level, which is the resolution the question is really being asked at, and they will tell you which blocks differ from the precinct average.
- Walk the route from the property to the nearest shops after dark. Lighting, foot traffic and sight lines decide how a place feels, and none of them appear in a statistic.
- Ask what the property already spends on security. Armed response contracts, beams, and whether the street has a paid patrol are all facts a seller can produce, and the answer tells you what the current owner concluded.
Insider tip: ask the agent for the previous three years of the property’s own security spend rather than for an opinion about the suburb. A house whose owner pays for a private patrol on top of armed response is telling you something the suburb average never will.
Where does the metro actually end?
At two different lines, and buyers keep using the wrong one. The City of Cape Town municipality reaches from Atlantis in the north to Simon’s Town in the south, but the commuting metro, meaning the area from which people routinely drive to the CBD or Bellville for work, stops well inside that.
The practical boundary sits at Somerset West in the east and Melkbosstrand in the north. Beyond those, a purchase changes character: Stellenbosch, Paarl and Franschhoek run their own local economies and their own rental markets, and Hermanus, Langebaan and Yzerfontein are second-home markets where the letting year is seasonal rather than continuous. That matters to an investor because a vacancy in a seasonal market is not a few weeks, it is the off season, and the yield arithmetic has to be written on eight months rather than twelve.
The Stellenbosch guide covers the Winelands case, where the local economy is strong enough that the seasonal caveat does not apply in the same way.
Which corridor suits which buyer?
Corridor choice decides the cost stack more than the suburb does. Sectional title dominates the Atlantic Seaboard and the City Bowl, so a body corporate levy sits between the owner and the property, while freehold dominates the Northern Suburbs, where Durbanville bands at R30,000 to R48,000 per square metre and models 6.8% to 8.0% gross. The Southern Suburbs school belt models 4% to 6% gross on freehold and Sea Point about 9.7% gross on a one-bedroom, so the yield ladder does not follow the price ladder. A buyer comparing the three should rebuild each on net, because a levy of R2,000 to R5,000 a month on a sectional title flat is several times the roughly R736 a month of municipal rates on a R2,000,000 home, and a freehold owner carries maintenance instead. The tables below match each buyer goal to a corridor and the trade-off that comes with it.
| If you want | Look at | Trade-off you accept |
|---|---|---|
| Best modelled rental yield | Sea Point, Atlantic Seaboard | Small units, highest entry price, nightly-letting rules in play |
| Schools and family stability | Southern Suburbs | Modelled 4% to 6% gross, no short-let market |
| Space and value | Northern Suburbs | Longer commute, no coastline, local buyer pool |
| Beach at a discount | Blaauwberg and West Coast | Wind, and a commute along the R27 |
| Village life over convenience | False Bay, Southern Peninsula | The metro’s longest commute |
| Estate living and semigration growth | Winelands, Helderberg | Outside the metro, thinner rental market |
| A second home rather than an asset | Overberg, far West Coast | Seasonal demand, long vacancy out of season |
The suburb yield table ranks the metro on modelled income, and the price table ranks it on cost. Read this page for where things are, and those two for what they cost and what they return.
Sources: corridor boundaries follow the City of Cape Town’s own planning designations, which differ from agent marketing in the cases noted above. Price bands and modelled yields from our suburb price table, which models listed prices against observed long-let rents rather than audited accounts. Atlantic Seaboard and City Bowl 2025 turnover of R11.3bn and the R2.8bn foreign-buyer share are drawn from reported 2025 sales data for those two corridors. Crime data is published by SAPS at police-precinct level; we deliberately publish no suburb-level safety score. Yields are modelled and not guaranteed. Current as at 7 September 2026.
Frequently Asked Questions
Cape Town's suburbs fall into nine corridors: the Atlantic Seaboard (11 areas from Mouille Point to Hout Bay), the City Bowl (10), the Southern Suburbs (18), the Northern Suburbs (16), Blaauwberg and the West Coast (9), False Bay and the Southern Peninsula (9), the Helderberg (3), the Cape Winelands (4) and the Overberg and far West Coast (5). Together the tables on this page name 85 suburbs and towns.
Start with the corridor table on this page, which gives the indicative entry price per square metre for each corridor: R80,000 on the Atlantic Seaboard, R55,000 in the City Bowl, R40,000 in the Southern Suburbs, R32,000 on the Blaauwberg coast and R30,000 in the Northern Suburbs. The suburb price table then ranks individual suburbs on cost.
The City of Cape Town municipality contains several hundred named suburbs, but a property buyer works with far fewer. Nine corridors cover almost every purchase decision in the metro and the near hinterland: the Atlantic Seaboard, the City Bowl, the Southern Suburbs, the Northern Suburbs, Blaauwberg and the West Coast, False Bay and the Southern Peninsula, the Helderberg, the Cape Winelands, and the Overberg coast. Around 80 suburbs inside those nine account for the overwhelming majority of transactions a foreign or semigration buyer will ever consider.
The Northern Suburbs, on both entry price and rand per square metre. Durbanville, the premium end of that corridor, carries an indicative R30,000 to R48,000 per square metre with tickets from about R2.0 million, and the older western end at Parow and Goodwood sits below that. The Atlantic Seaboard is the most expensive, starting at R80,000 per square metre in Sea Point and running past R180,000 in Clifton and Bantry Bay. The Southern Suburbs school belt sits between the two.
We do not publish a safety ranking, because we have no dataset that would make one honest. Crime in Cape Town is reported by SAPS at police-precinct level, and precincts do not map cleanly onto suburbs: one precinct routinely covers areas with very different conditions. Use the SAPS quarterly crime statistics for the precinct that covers the address, ask the local neighbourhood watch or community policing forum about the specific streets, and walk the route from the property to the nearest shops after dark before you decide.
The Atlantic Seaboard and the City Bowl, by a wide margin. Those two corridors recorded R11.3bn of combined residential sales turnover in 2025, of which about R2.8bn, roughly 25% of value, came from foreign buyers. The Southern Suburbs draw a smaller foreign cohort, usually families connected to the schools or the university. The Northern Suburbs are overwhelmingly a local and semigration market, which is the reverse of the coast.
Sea Point, on the modelled numbers: about 9.7% gross and 7.5% net on a one-bedroom apartment, the best on the Atlantic Seaboard. The reason is the ratio rather than the rent, because entry prices there sit closest to what tenants can actually pay. Durbanville in the Northern Suburbs models 6.8% to 8.0% gross, and the Southern Suburbs school belt runs 4% to 6% on freehold. Constantia estate homes model under 4%, because they are priced on land rather than on income.
They are different corridors that visitors constantly confuse. The Southern Suburbs are the inland school belt on the eastern flank of Table Mountain, from Woodstock down to Steenberg, defined by UCT and the private schools. The Southern Peninsula, also called False Bay, is the coastal strip further south, from Muizenberg and Kalk Bay through Fish Hoek to Simon's Town and around to Noordhoek and Kommetjie. The peninsula is cheaper, further from the CBD, and its market is driven by lifestyle and surf rather than by schools.
Get a Cape Town property shortlist
Share your budget, target area (Atlantic Seaboard, City Bowl, Winelands), and goal. We reply within one business day with matched stock and next steps.